How to find mean in statistics?
An introduction to How to find mean in statistics?

Name: Own Teacher
Email: info@ownteacher.com
Created At: 03-11-2023
In statistics, the mean is a measure of central tendency that represents the average value of a set of data points. It is often referred to as the "arithmetic mean." To find the mean of a dataset, follow these steps:
Collect Your Data: First, gather the data you want to analyze. The data can come in various forms, such as a list of numbers, measurements, or observations.
Add Up the Values: Sum all the data points in your dataset. If you have a set of values, you can add them together using the "+" operator. This step is represented mathematically as:
Sum=x1+x2+x3+…+xn
where x1,x2,x3,…,xn are the individual data points, and n is the total number of data points.
Count the Data Points: Determine the total number of data points in your dataset. This is typically denoted as "n" and represents the count of data points.
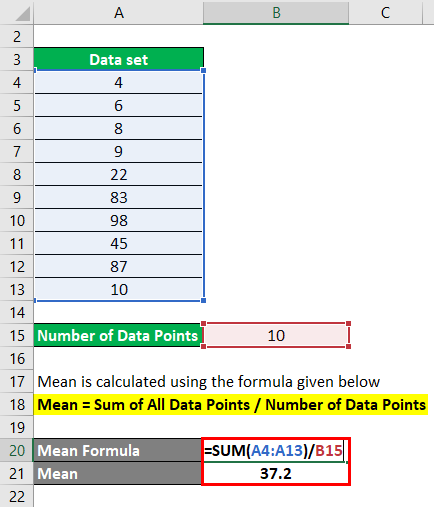
Calculate the Mean: The mean (μ) is calculated by dividing the sum of the data points by the total number of data points:
μ=Sum/n
Mathematically, this can be represented as:
μ=nx1+x2+x3+…+xn / n
Interpret the Result: The mean is the average value of your dataset. It gives you a single value that represents the center of the data. It's essential for summarizing and comparing data, but keep in mind that it can be affected by outliers in your dataset, so it may not always represent the "typical" value.
Here's an example to illustrate how to calculate the mean:
Suppose you have the following dataset of exam scores for five students: 85, 90, 78, 92, and 88.
- Sum the values: 85+90+78+92+88=43385+90+78+92+88=433
- Count the data points: n=5
- Calculate the mean: μ= 433/5 =86.6
So, the mean exam score for these five students is 86.6.
Keep in mind that the mean is just one measure of central tendency, and it may not always provide a complete picture of your data. It's essential to consider other measures like the median and mode, especially when dealing with skewed or non-normally distributed data.
Certainly! Let's go through the process of finding the mean in statistics with a detailed explanation and an example.
Step 1: Collect Your Data
Suppose you have a dataset of test scores for a class of 10 students: {75, 80, 92, 88, 64, 76, 85, 90, 78, 83}.
Step 2: Add Up the Values
Calculate the sum of all the data points in your dataset. This is done by adding all the individual values together:
Sum = 75 + 80 + 92 + 88 + 64 + 76 + 85 + 90 + 78 + 83
Sum = 811
Step 3: Count the Data Points
Determine the total number of data points in your dataset. In this case, you have 10 data points.
Step 4: Calculate the Mean
Now, you can calculate the mean (μ) by dividing the sum of the data points by the total number of data points:
μ=nSum
μ=811/10
μ=81.1
So, the mean test score for this class of 10 students is 81.1.
Step 5: Interpret the Result
The mean, in this case, tells you that the average test score for the class is 81.1. It's a measure of central tendency and provides a sense of the "typical" test score for these students. However, remember that the mean can be influenced by outliers, so it's important to consider other measures of central tendency and dispersion (such as the median and standard deviation) to fully understand the characteristics of your data.
In this example, the mean of 81.1 is a valuable summary of the data, but you may also want to calculate other statistics to gain a more comprehensive view of the test scores, especially if you suspect that some students' scores significantly deviate from the others.
Comment List
Leave a Comment.